
Rohban ORF pathway screen#
rohban() serves cpg0017-rohban-pathways [Rohban et al., 2017], an overexpression screen rather than a knockout or a small-molecule one. U2OS cells each overexpress one open reading frame, with roughly ten replicate wells per construct over five plates, so a hit is a gene whose gain of function moves the cells away from the control ORFs. The genes group into known signalling pathways, which is what makes it the pathway example. The object is well-level.
Use it if your own data is an overexpression (gain-of-function) screen, or any well-level genetic screen where you want to read hits against pathway structure. Interpreting a screen end to end and Which measurements moved both run on it.
import numpy as np
import pandas as pd
import plotly.express as px
import scanpy as sc

import mantispy as mt
adata = mt.ds.rohban()
adata
AnnData object with n_obs × n_vars = 1918 × 3616
    obs: 'Metadata_gene_name', 'Metadata_pert_name', 'Metadata_broad_sample', 'Metadata_cell_line', 'Metadata_ASSAY_WELL_ROLE', 'Metadata_GeneID', 'Metadata_Plate', 'Metadata_Well', 'Metadata_Site_Count', 'Metadata_Count_Cells', 'Metadata_Count_CellsIncludingEdges', 'Metadata_Count_Cytoplasm', 'Metadata_Count_Nuclei', 'Metadata_Count_NucleiIncludingEdges', 'Metadata_Object_Count', 'Metadata_CellCount', 'Metadata_SiteCount', 'Metadata_Control', 'Metadata_Perturbation', 'Metadata_Perturbation_Type', 'Metadata_Gene', 'Metadata_Construct', 'Metadata_Allele'
    var: 'object', 'feature_group', 'feature', 'channel', 'scale', 'angle', 'gray_levels', 'radial_bin', 'params', 'is_feature'
    uns: 'mantispy'
    layers: None (.X)
Constructs, genes and controls#
Metadata_Perturbation is the ORF construct, the unit the screen varied, and several constructs can overexpress the same Metadata_Gene. Metadata_Control marks the control ORFs (Luciferase, LacZ and eGFP) that normalization reads against; the untreated EMPTY wells carry Metadata_Perturbation == "untreated" and are not flagged.
obs = adata.obs
pd.Series(
    {
        "wells": adata.n_obs,
        "constructs": obs["Metadata_Perturbation"].nunique(),
        "genes": obs["Metadata_Gene"].nunique(),
        "plates": obs["Metadata_Plate"].nunique(),
        "control wells": int(obs["Metadata_Control"].sum()),
    }
)
wells            1918
constructs        327
genes             194
plates              5
control wells     120
dtype: int64
Cell count across the five plates#
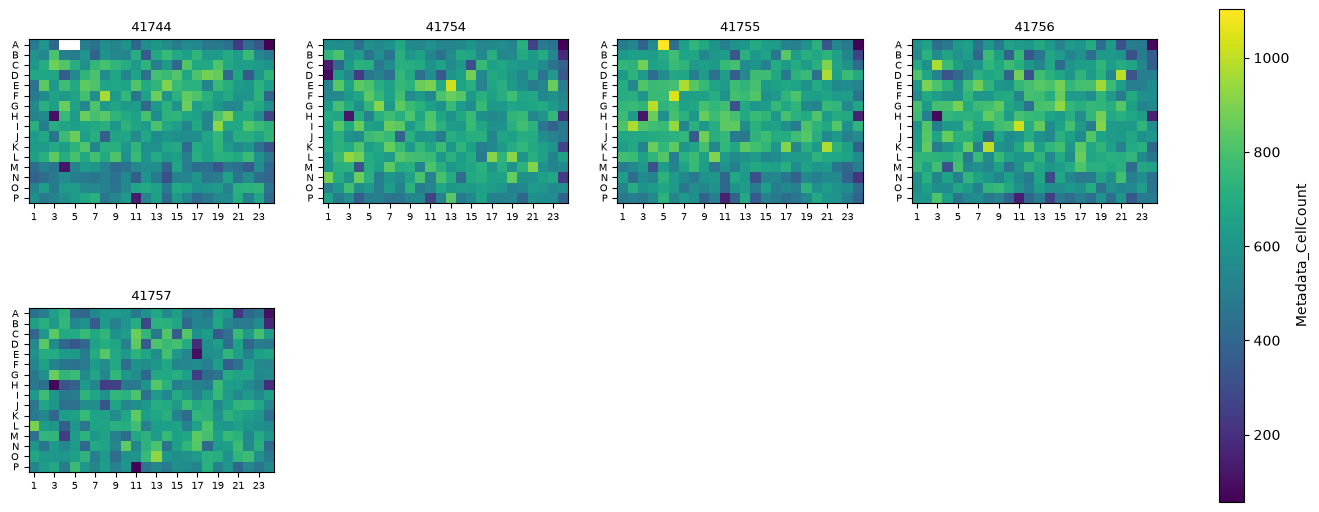
Overexpression changes proliferation, which cell count picks up plate by plate.
mt.pl.plate(adata, color="Metadata_CellCount")
Genes in profile space#
The gene-level consensus (one modz profile per gene) placed on its first two principal components shows the spread the pathways sit in. Each point is a gene, sized by how many replicate wells backed its consensus.
genes = mt.ds.rohban(aggregated=True)
scaled = genes.copy()
sc.pp.scale(scaled)
scaled.X = np.nan_to_num(scaled.X)
sc.pp.pca(scaled, n_comps=10)
coords = pd.DataFrame(scaled.obsm["X_pca"][:, :2], columns=["PC1", "PC2"])
coords["gene"] = genes.obs["Metadata_Gene"].to_numpy()
coords["replicates"] = genes.obs["Metadata_ReplicateCount"].to_numpy()
fig = px.scatter(
    coords,
    x="PC1",
    y="PC2",
    color="replicates",
    hover_name="gene",
    title="Rohban genes in profile space",
)
fig.show()