
Overview#
mantispy.ds ships example screens that span several assays and resolutions. This page places them against each other, so you can find the one closest to your own data, and then shows where the per-well cell counts come from.
Which dataset is like yours#
dataset |
assay and perturbation |
unit of analysis |
size |
the example of |
|---|---|---|---|---|
compound screen, 38 compounds and DMSO, MCF-7 |
well |
632 wells, 103 treatments |
the mechanism-of-action benchmark |
|
ORF overexpression (gain of function), U2OS |
well |
1,918 wells, 5 plates |
pathway hits by overexpression |
|
kinase inhibitors, few doses and many replicates, U2OS |
well |
3,072 wells, 8 plates |
hit calling and normalization |
|
36 compounds over a 10-point dose range, U2OS and HepaRG |
well |
12 plates, two cell lines |
concentration-response curves |
|
one JUMP compound plate map run at every site |
well |
up to 141 plates, 11 sources |
cross-laboratory batch effects |
|
CRISPR knockout (loss of function), U2OS |
well (guides as replicates) |
51,185 wells |
an arrayed genetic screen |
|
one JUMP plate map under six feature sets |
well (one field each) |
4 plates, 1,536 wells |
embeddings against CellProfiler |
|
alternative-dye pilot, 8 channels, 91 compounds |
well |
8 acquisitions |
a non-standard stain panel |
|
iPSC neurons and astrocytes, no perturbation |
well |
1,691 wells, 20x and 63x |
a design-factor screen (genotype, donor) |
|
pooled coding-variant screen, pre-aggregated |
barcode |
290 barcodes, 132 genes |
a pre-aggregated allele series |
|
optical pooled CRISPR under ARV-471, targeted readout |
single cell |
2M+ cells, 9 features |
a single-cell pooled screen |
|
optical pooled CRISPR knockout, broad morphology |
single cell |
124 genes, ~1,278 features |
broad single-cell pooled morphology |
|
single cells of one JUMP plate |
single cell |
13,578 cells, 24 wells |
per-cell CellProfiler measurements |
|
images and segmentations of one well |
image (field of view) |
2 fields, 8 channels |
raw images as SpatialData |
|
one raw CellProfiler export |
field of view |
1 field |
the input to |
Well counts#
Every well-level screen, with how many wells, features and controls it has, and how many cells a well holds.
import matplotlib.pyplot as plt
import numpy as np
import pandas as pd

import mantispy as mt
WELLS = [
    "bbbc021",
    "rohban",
    "pki",
    "jump_target2",
    "jump_crispr",
    "neuropainting",
    "chroma",
    "oasis_pilot",
]
datasets = {name: getattr(mt.ds, name)() for name in WELLS}

rows = []
for name, adata in datasets.items():
    obs = adata.obs
    rows.append(
        {
            "dataset": name,
            "accession": adata.uns["mantispy"]["dataset"],
            "wells": adata.n_obs,
            "features": adata.n_vars,
            "plates": obs["Metadata_Plate"].nunique(),
            "controls": int(obs["Metadata_Control"].sum()) if "Metadata_Control" in obs else pd.NA,
            "cells per well": obs["Metadata_CellCount"].median(),
            "fields per well": obs["Metadata_SiteCount"].median() if "Metadata_SiteCount" in obs else pd.NA,
        }
    )
pd.DataFrame(rows).set_index("dataset")
| accession | wells | features | plates | controls | cells per well | fields per well | |
|---|---|---|---|---|---|---|---|
| dataset | |||||||
| bbbc021 | BBBC021 | 632 | 467 | 55 | 330 | 592.0 | 4.0 |
| rohban | cpg0017-rohban-pathways | 1918 | 3616 | 5 | 120 | 633.0 | 9.0 |
| pki | cpg0008-pki | 3072 | 5839 | 8 | 832 | 1669.0 | 9.0 |
| jump_target2 | cpg0016-jump | 5374 | 3616 | 11 | 898 | 1427.5 | 9.0 |
| jump_crispr | cpg0016-jump-assembled | 51185 | 595 | 148 | 7478 | 3093.0 | <NA> |
| neuropainting | cpg0038-tegtmeyer-neuropainting | 1691 | 204 | 4 | <NA> | 92.0 | 4.0 |
| chroma | cpg0029-chroma-pilot | 3455 | 64 | 8 | 216 | 625.0 | 9.0 |
| oasis_pilot | cpg0033-oasis-pilot | 4604 | 99 | 12 | 511 | 4443.5 | 9.0 |
controls is Metadata_Control, which the loaders of bbbc021, rohban, pki, jump_target2, jump_crispr and
oasis_pilot set.
chroma marks its untreated wells negcon in Metadata_control_type instead.
Five datasets are left out of the well-count table:
pooled_rareholds one profile per barcode of a pooled screen, so there is no well to count cells in;jump_cellsholds 13,578 single cells of one JUMP plate, see its page;jump_plateholds the images and segmentations of one well of the same plate;jump_exportis the CellProfiler export directory of one field of view of that plate;jump_liteholds the same 1,536 JUMP wells under six feature sets, see its page.
Where the cell counts come from#
Metadata_CellCount is the number of cells behind a row, and Metadata_SiteCount the number of fields of view
that contributed cells.
Every count is exact, taken from what the upstream pipeline measured:
dataset |
cell count |
|---|---|
bbbc021 |
summed from the |
rohban, pki |
|
oasis_pilot, chroma |
|
neuropainting |
|
jump_target2 |
each plate’s backend table, see its page |
jump_crispr |
|
Metadata_Object_Count is the number of cells pycytominer aggregated into a well.
It equals Metadata_Count_Cells in every well of every file here that publishes both, so it is as exact.
read_profiles() copies either one to Metadata_CellCount, and Metadata_Site_Count to Metadata_SiteCount, so a Gallery file read directly carries them too.
Cells per field#
Datasets image different numbers of fields per well, and so do plates within some of them. Cells per field compares them on one scale.
per_field = {
    name: (adata.obs["Metadata_CellCount"] / adata.obs["Metadata_SiteCount"]).dropna().to_numpy()
    for name, adata in datasets.items()
    if "Metadata_SiteCount" in adata.obs
}
order = sorted(per_field, key=lambda name: np.median(per_field[name]))
fig, ax = plt.subplots(figsize=(8, 4))
ax.boxplot([per_field[name] for name in order], tick_labels=order, showfliers=False)
ax.set_yscale("log")
ax.set_ylabel("cells per field of view")
ax.tick_params(axis="x", rotation=45)
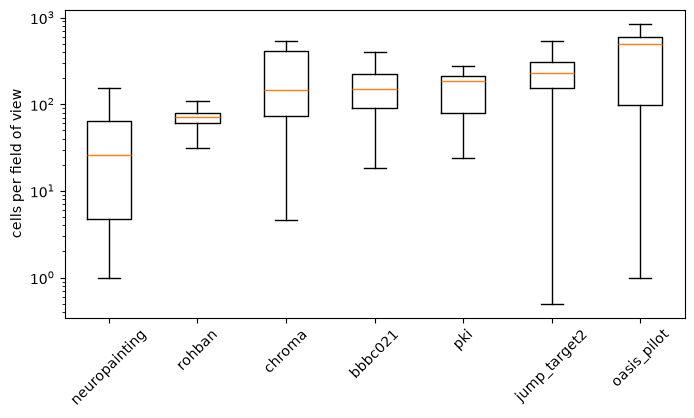
Metadata_SiteCount counts the fields of view that contributed cells, which need not be all those imaged: an empty field
contributes none, and so does one left out of the analysis.
JUMP-Target-2 has examples of both.
jump_crispr has no field count, because the recipe’s table publishes none.